
Dashboard
The Dashboard is your restaurant's command center, providing real-time insights and key performance metrics at a glance. Access it immediately after logging in or navigate to Dashboard from the main menu.
Overview
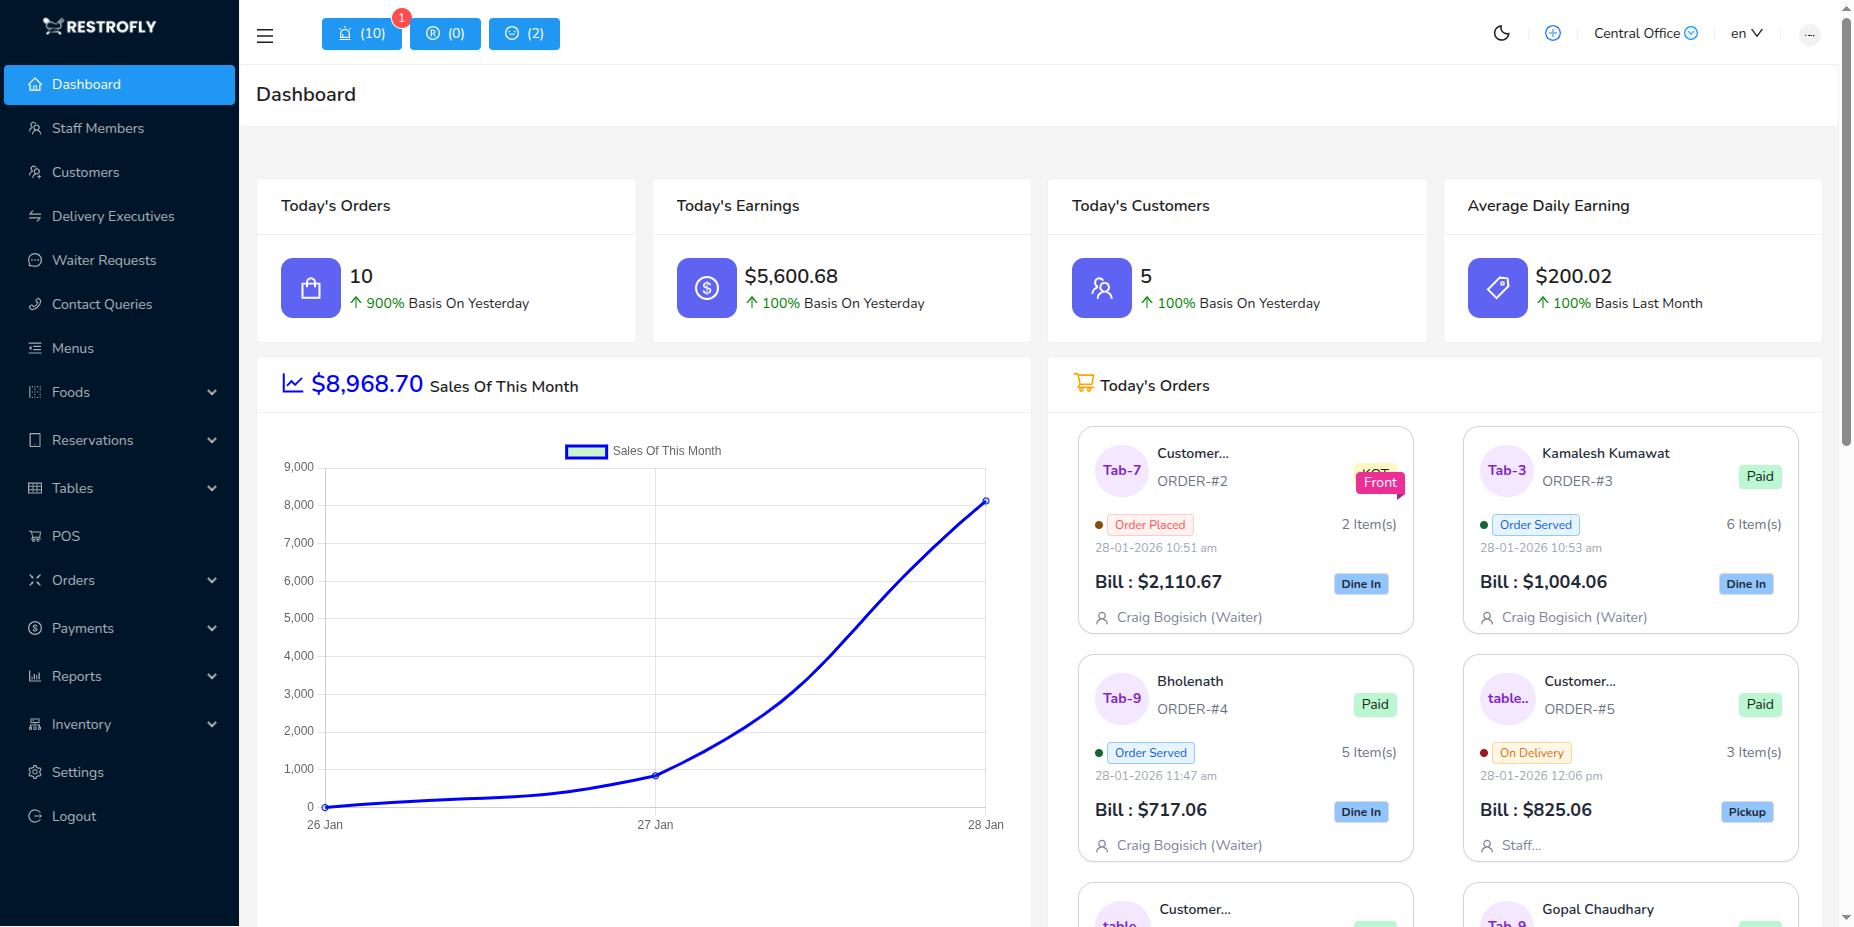
The Dashboard displays critical restaurant metrics and visualizations to help you monitor daily operations and make data-driven decisions quickly.
Key Metrics Widgets
The top row displays four essential performance indicators:
Today's Orders
- Shows total number of orders placed today
- Compares with yesterday's performance as a percentage
- Green upward arrow indicates increase, red downward arrow indicates decrease
- Helps track daily customer traffic and demand
Today's Earnings
- Displays total revenue generated today in your configured currency
- Percentage comparison with yesterday's earnings
- Real-time updates as orders are completed and paid
- Essential for monitoring daily financial performance
Today's Customers
- Total number of unique customers served today
- Tracks both dine-in and takeaway customers
- Percentage change from yesterday
- Useful for understanding customer footfall trends
Average Daily Earning
- Shows the average daily revenue for the current month
- Compares with last month's average as a percentage
- Helps identify monthly revenue trends and patterns
- Useful for forecasting and goal setting
Performance Tracking
Monitor the percentage changes in these widgets daily. Consistent negative trends may indicate issues requiring attention, while positive trends show successful strategies.
Dashboard Charts and Visualizations
Performance Chart
- Visual representation of orders and revenue over time
- Line or bar chart showing daily/weekly/monthly performance
- Helps identify peak periods and slow times
- Useful for staff scheduling and inventory planning
Today's Orders Breakdown
- Pie chart or list showing order distribution
- Categories: Dine-in, Takeaway, Delivery
- Helps understand customer ordering preferences
- Essential for resource allocation
All Payments
- Summary of payment methods used
- Cash, Card, Online payments breakdown
- Tracks payment trends and cash flow
- Useful for reconciliation and accounting
Top Selling Tables
- Lists tables generating highest revenue
- Shows table utilization and performance
- Helps identify popular seating areas
- Useful for table management and layout optimization
Top Selling Dishes
- Displays best-performing menu items
- Shows quantity sold and revenue generated
- Helps with menu optimization and inventory planning
- Identifies customer favorites and slow-moving items
Using Dashboard Data
Daily Operations
- Check morning metrics to plan for the day
- Monitor real-time performance during peak hours
- Review end-of-day summaries for closing procedures
Weekly Planning
- Compare daily metrics across the week
- Identify weekly patterns and trends
- Plan staff schedules based on busy days
Monthly Analysis
- Review average daily earnings trends
- Analyze month-over-month growth
- Set targets and goals for the next month
Strategic Decisions
- Use top-selling dishes data for menu planning
- Optimize table layouts based on performance
- Adjust pricing and promotions based on revenue trends
Branch Selection
If you manage multiple branches, use the branch selector in the top menu to switch between branch dashboards and view location-specific metrics.
Best Practices
Morning Routine
- Check dashboard first thing when opening
- Review yesterday's performance
- Set daily targets based on trends
Real-Time Monitoring
- Keep dashboard visible during service hours
- Monitor today's metrics against targets
- Respond quickly to unusual patterns
End of Day
- Review all metrics before closing
- Compare actual vs. targeted performance
- Note any anomalies for investigation
Regular Analysis
- Review weekly and monthly trends
- Identify seasonal patterns
- Use data to make informed business decisions
Data Accuracy
Dashboard metrics update in real-time based on order and payment activities. Ensure staff properly processes all orders through the system for accurate reporting.
Dashboard Customization
Some dashboard elements may be customizable based on your system configuration. Contact your administrator if you need specific metrics or visualizations added.