
Reports
The Reports module provides comprehensive business intelligence and analytics for your restaurant operations. Access detailed insights into sales performance, payment trends, inventory movement, tax compliance, and customer behavior. Navigate to Reports from the main menu to access all reporting features.
Overview
Restrofly's reporting system offers real-time data analysis with powerful filtering options and multiple export formats. All reports support:
- Date Range Filtering: Today, Yesterday, This Week, This Month, Last Month, Custom Range
- Branch Filtering: Multi-branch restaurants can filter by specific locations
- Export Options: CSV, PDF, and Excel (XLSX) formats
- Real-time Data: Reports reflect current database state
- Summary Totals: Automatic calculation of totals and subtotals
Report Best Practices
Generate reports regularly to track trends, identify opportunities, and make data-driven decisions. Export reports for accounting, tax filing, and business analysis.
1. Sales Summary Report
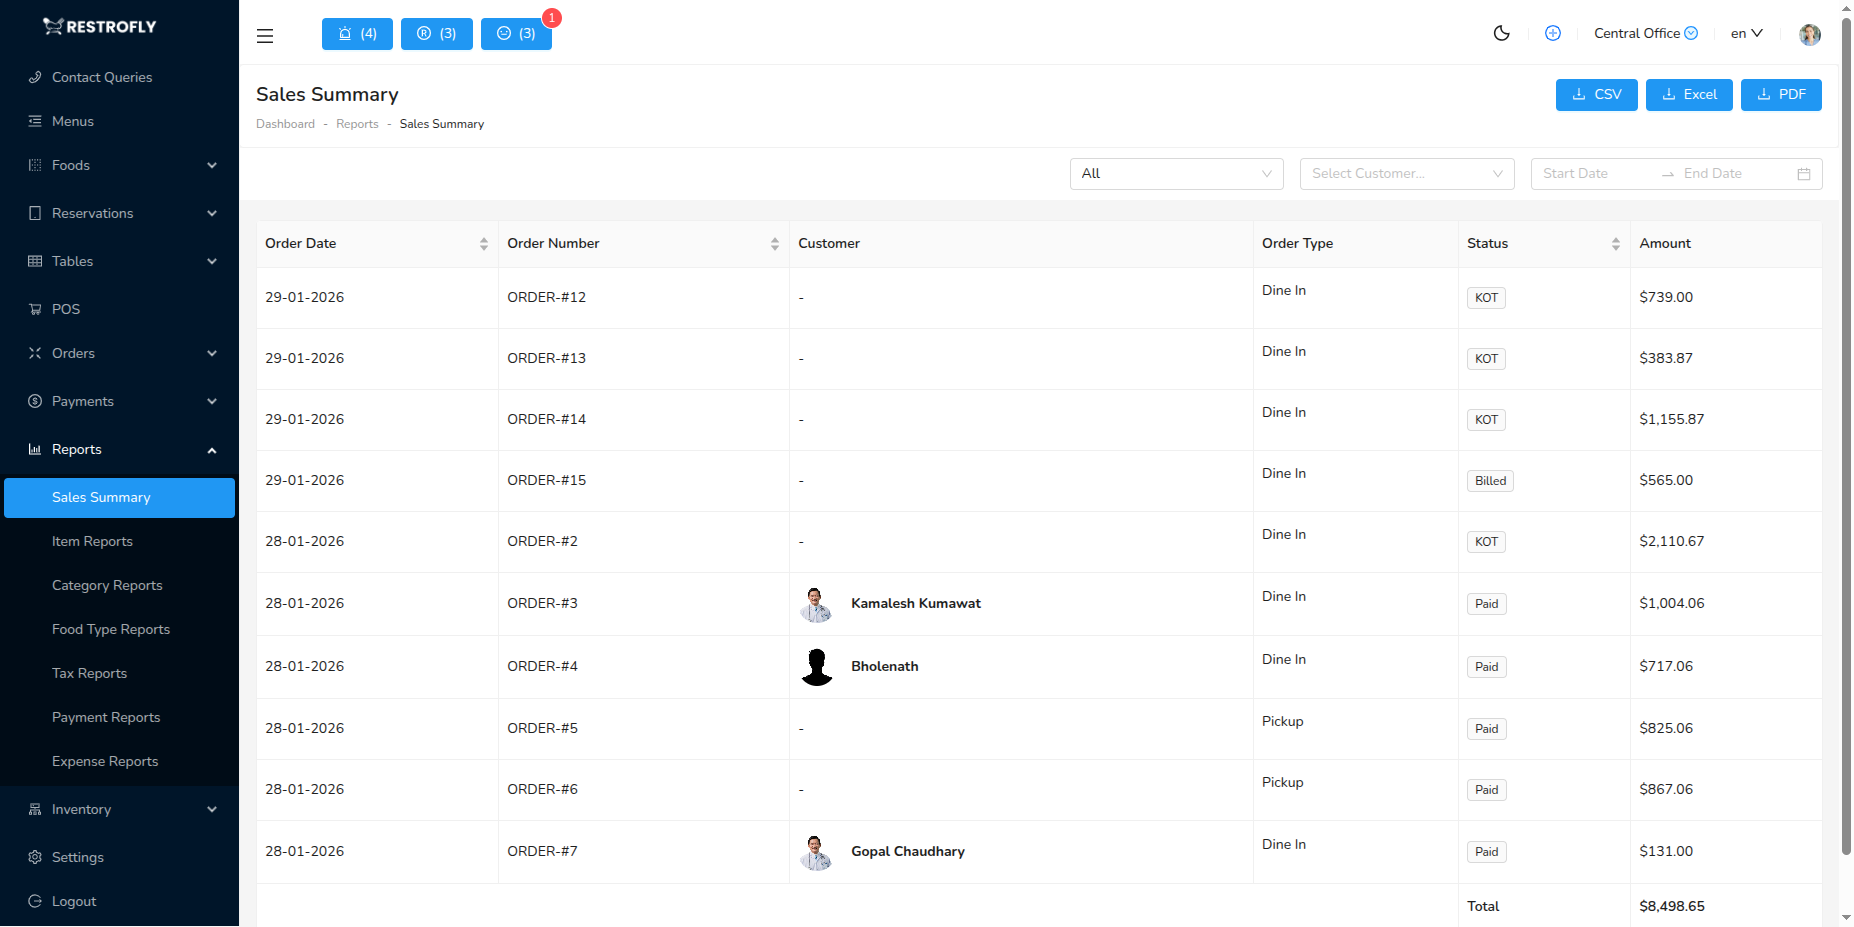
The Sales Summary report provides a comprehensive overview of all orders and transactions within a selected date range. This is your primary report for understanding overall business performance.
What This Report Shows
The Sales Summary displays detailed information about each order:
- Order Date: When the order was placed/completed
- Order Number: Unique order identifier for tracking
- Customer: Customer name and profile (if registered customer)
- Order Type: Classification of order
- Dine-In: Customers eating at restaurant
- Takeaway: Orders for pickup
- Delivery: Orders delivered to customer location
- Waiter/Staff: Staff member who handled the order
- Status: Current order status (KOT, Ready, Billed, Paid, Cancelled)
- Total Amount: Final order amount including all taxes
Data Fetching Process
The system fetches sales summary data from the sales-summary API endpoint with the following parameters:
API Details:
- URL: /api/sales-summary
- Method: POST
- Parameters:
- dates: [start_date, end_date]
- customer_id: (optional) Filter by specific customer
- order_type: (optional) Filter by order type
- sales_summary_reports: true
The report retrieves complete order information including customer details, staff member information, and automatically calculates the total amount summary at the bottom of the report.
Filter Options
By Date Range
- Select custom date range using date picker
- Quick filters: Today, Yesterday, This Week, This Month
- Date range affects all orders displayed
By Customer
- Filter to see all orders from a specific customer
- Useful for customer-specific analysis and loyalty tracking
- Shows customer purchase patterns
By Order Type
- Filter by Dine-In, Takeaway, or Delivery
- Compare performance across different service channels
- Identify which order type generates most revenue
Summary Calculations
At the bottom of the report, you'll see:
- Total Amount: Sum of all order totals in the filtered results
- Automatically updates based on applied filters
- Excludes cancelled orders from total
Use Cases
Daily Revenue Tracking
- Check end-of-day sales performance
- Compare to previous days
- Track daily trends and patterns
Customer Analysis
- Identify high-value customers
- Track customer order frequency
- Analyze customer spending patterns
Order Type Performance
- Compare dine-in vs takeaway vs delivery revenue
- Optimize operations for each channel
- Identify most profitable order type
Waiter Performance
- Track sales by staff member
- Identify top-performing waiters
- Calculate commission or incentives
Accounting & Reconciliation
- Match reported sales with actual cash/card collections
- Verify daily revenue figures
- Prepare financial statements
Exporting Sales Summary
Click the Export button to download the report:
- CSV: Open in Excel, Google Sheets, or accounting software
- PDF: Print for records or share with stakeholders
- Excel: XLSX format with formulas and formatting
Daily Reconciliation
Generate Sales Summary reports daily to reconcile with actual cash drawer and card terminal collections. This helps identify discrepancies immediately.
2. Item Reports (Product Sales Summary)
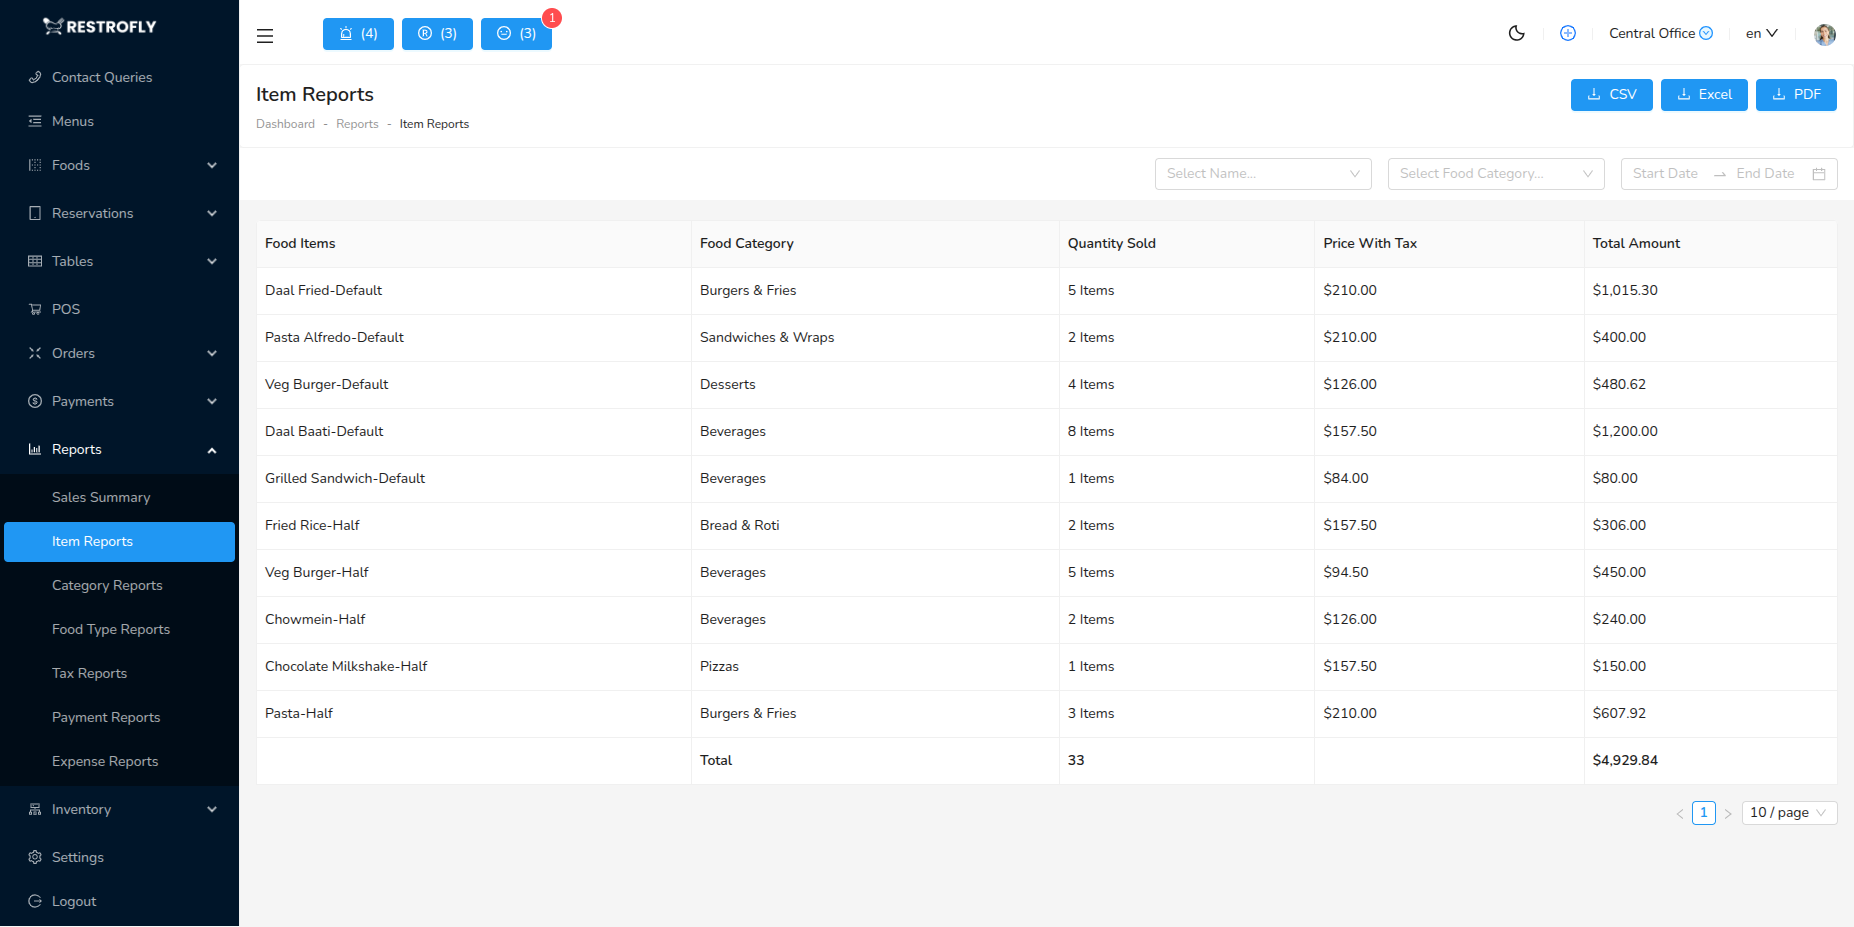
The Item Reports provide detailed sales analytics for individual menu items and their variants. This report is essential for menu optimization and inventory planning.
What This Report Shows
Item Reports display sales data at the variant level:
- Item Name: Food item name with variant (e.g., "Margherita Pizza - Large")
- Category: Food category the item belongs to
- Quantity Sold: Total number of units sold in the period
- Price with Tax: Individual unit price including applicable taxes
- Total Amount: Total revenue from this item (Quantity × Price)
Data Fetching Process
The system retrieves item-level sales data from the item-reports API endpoint:
API Details:
- URL: /api/item-reports
- Method: POST
- Parameters:
- dates: [start_date, end_date]
- food_category_id: (optional) Filter by category
- food_item_id: (optional) Filter by specific item
- product_sales_summary: true
The report shows every variant as a separate line item, combining the food item name with the variant name (size, spice level, customization, etc.). It automatically calculates quantity sold and total revenue for each variant.
Understanding Variants in the Report
Food items in Restrofly can have multiple variants (sizes, styles, customizations):
- Example: "Burger - Regular" vs "Burger - Large"
- Example: "Coffee - Hot" vs "Coffee - Cold"
- Example: "Curry - Mild" vs "Curry - Spicy"
Each variant appears as a separate row in the report with its own sales data. This granular view helps you understand which specific variants customers prefer.
Filter Options
By Date Range
- Select period to analyze item performance
- Compare week-over-week or month-over-month
- Identify seasonal trends
By Food Category
- Filter to see sales for specific category (Appetizers, Main Course, Desserts, etc.)
- Compare performance across categories
- Focus analysis on specific menu sections
By Food Item
- Drill down to specific item and its variants
- Analyze which variants sell best
- Understand size/style preferences
Summary Calculations
The report automatically totals:
- Total Units Sold: Sum of all quantity_sold values
- Total Sales Revenue: Sum of all total_amount values
- Helps calculate average selling price per unit
Use Cases
Menu Optimization
- Identify best-selling items to feature prominently
- Find slow-moving items to remove or discount
- Understand which variants customers prefer
Inventory Planning
- Order ingredients based on item sales trends
- Predict future demand for popular items
- Avoid overstocking ingredients for slow sellers
Pricing Strategy
- Compare variants to understand price sensitivity
- Identify items that generate most revenue
- Adjust pricing for better profitability
Kitchen Staffing
- Prepare popular items in advance during peak hours
- Train staff on most-ordered items
- Optimize kitchen workflow based on demand
Marketing & Promotions
- Promote underperforming items
- Create combo offers with popular items
- Highlight bestsellers in marketing materials
Analyzing the Data
Top Sellers
- Sort by Quantity Sold to find most popular items
- These items should always be in stock
- Consider featuring in promotions
Revenue Drivers
- Sort by Total Amount to find high-revenue items
- These items contribute most to profitability
- Protect pricing and quality
Slow Movers
- Items with low quantities need attention
- Consider removal, repositioning, or promotion
- May indicate ingredient issues or poor placement
Variant Analysis
- Compare variants of the same item
- Optimize variant offerings based on demand
- Simplify menu by removing unwanted variants
Menu Engineering
Use Item Reports monthly to review your menu. Remove bottom 10% performers and test new items in their place. Focus kitchen and marketing efforts on proven winners.
3. Category Reports (Food Category Summary)
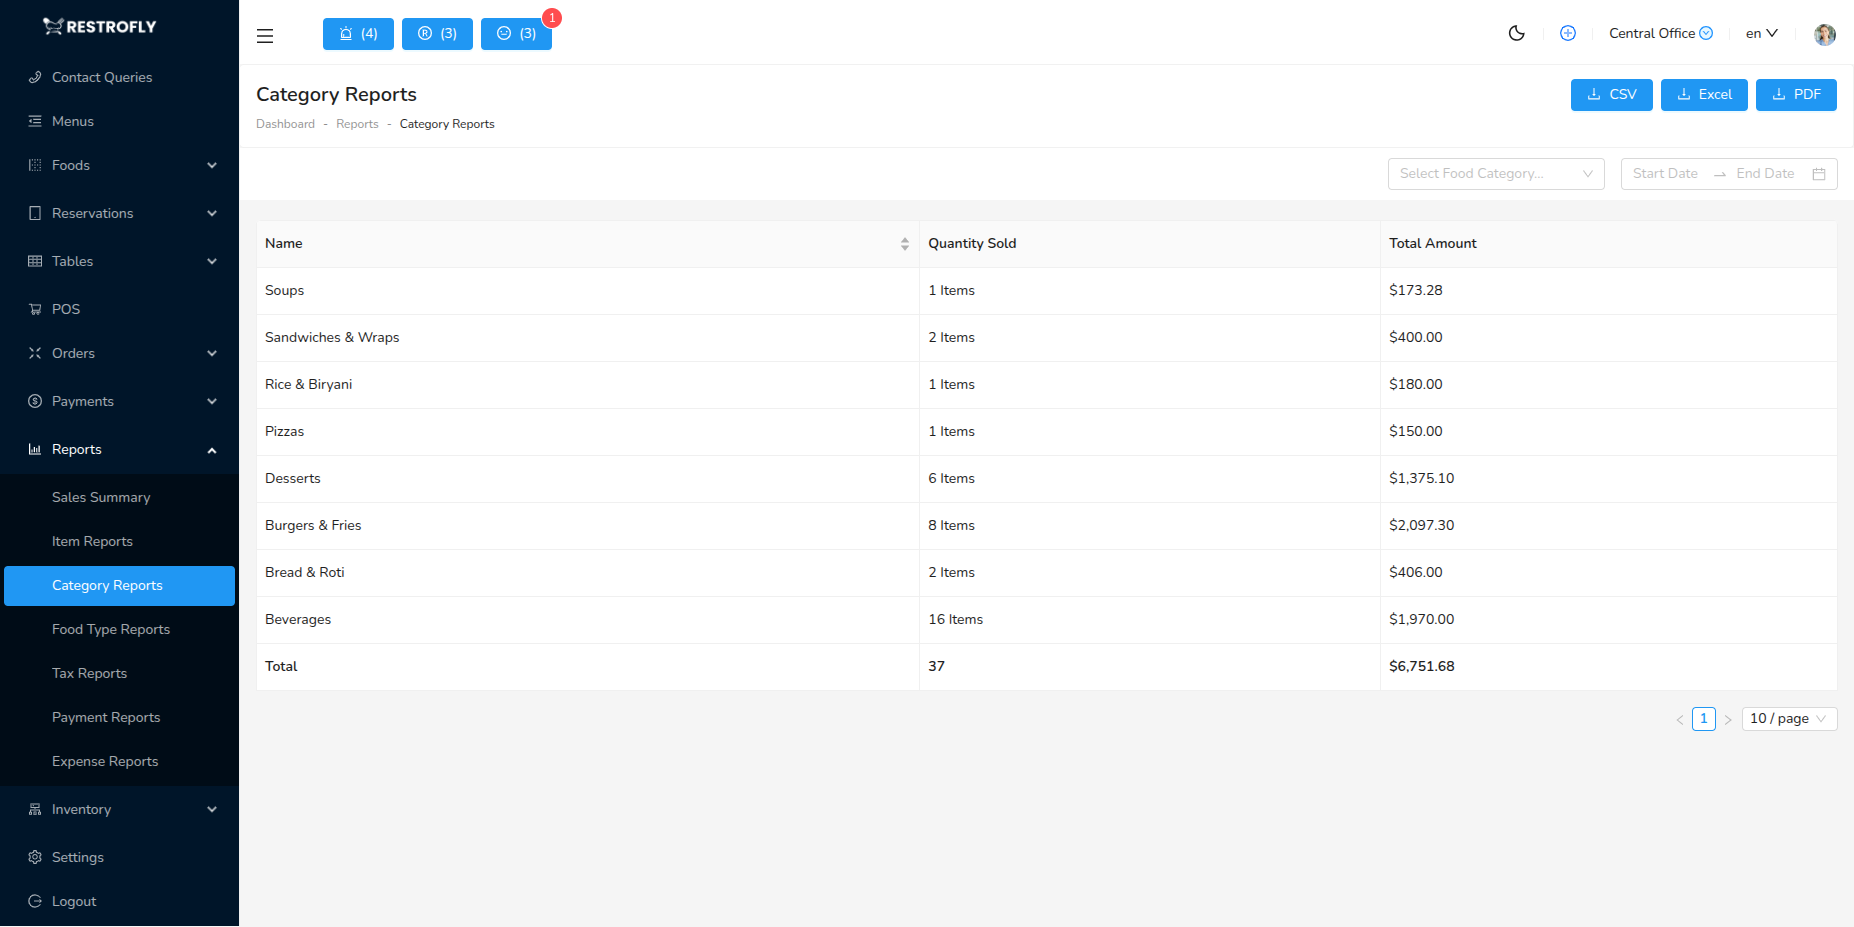
Category Reports provide high-level sales analysis grouped by food categories. This report helps you understand which menu sections drive the most revenue and customer interest.
What This Report Shows
Category Reports aggregate sales data by food category:
- Category Name: Food category (e.g., Appetizers, Main Course, Desserts, Beverages)
- Units Sold: Total quantity of all items in this category
- Total Amount: Total revenue generated by this category
Data Fetching Process
The system fetches category-level data from the category-reports API endpoint:
API Details:
- URL: /api/category-reports
- Method: POST
- Parameters:
- dates: [start_date, end_date]
- food_category_id: (optional) Filter by specific category
- food_category_summary: true
The report groups all food items within each category and calculates aggregate sales figures. Each category appears as a single row with totaled data from all items within that category.
Understanding Category Grouping
Categories in Restrofly are organizational units for your menu:
- Appetizers: Starters, snacks, salads
- Main Course: Entrees, primary dishes
- Desserts: Sweets, ice cream, cakes
- Beverages: Drinks, juices, coffee, tea
- Special Menu: Seasonal or promotional items
- Custom Categories: Any categories you define
All food items assigned to a category contribute to that category's totals in this report.
Filter Options
By Date Range
- Analyze category performance over time
- Identify seasonal category trends
- Compare month-to-month changes
By Specific Category
- Focus on a single category for detailed analysis
- Break down category performance
- Drill deeper after identifying issues
Summary Calculations
The report provides:
- Total Units Sold: Combined quantity across all categories
- Total Sales Revenue: Combined revenue across all categories
- Percentage of each category to total (calculated manually)
Use Cases
Menu Balance Analysis
- Ensure balanced revenue across categories
- Identify over-dependence on single category
- Plan menu expansions strategically
Category Performance
- Compare categories to find strongest performers
- Identify underperforming menu sections
- Allocate kitchen resources appropriately
Menu Development
- Decide which categories need more items
- Identify gaps in menu offerings
- Plan new item development by category
Marketing Strategy
- Promote underperforming categories
- Feature high-performing categories in advertising
- Create category-specific promotions
Cost Management
- Allocate ingredient budget by category
- Focus cost control on high-volume categories
- Optimize kitchen space for top categories
Analyzing Category Performance
Revenue Distribution
- Ideally, no single category should dominate (unless by design)
- Balanced distribution indicates well-rounded menu
- Heavy concentration may indicate limited offerings
Units vs Revenue
- High units with low revenue: Low-priced items dominating
- Low units with high revenue: Premium items category
- Adjust pricing or offerings accordingly
Seasonal Patterns
- Beverages may increase in summer
- Desserts may spike during holidays
- Plan inventory and staffing around trends
Customer Preferences
- Category sales reflect what customers want
- Expand successful categories
- Reduce or reposition weak categories
Category Strategy
Don't remove a category just because it has low sales. Some categories (like Desserts) have lower volume but high margins and enhance overall customer experience.
4. Food Type Reports
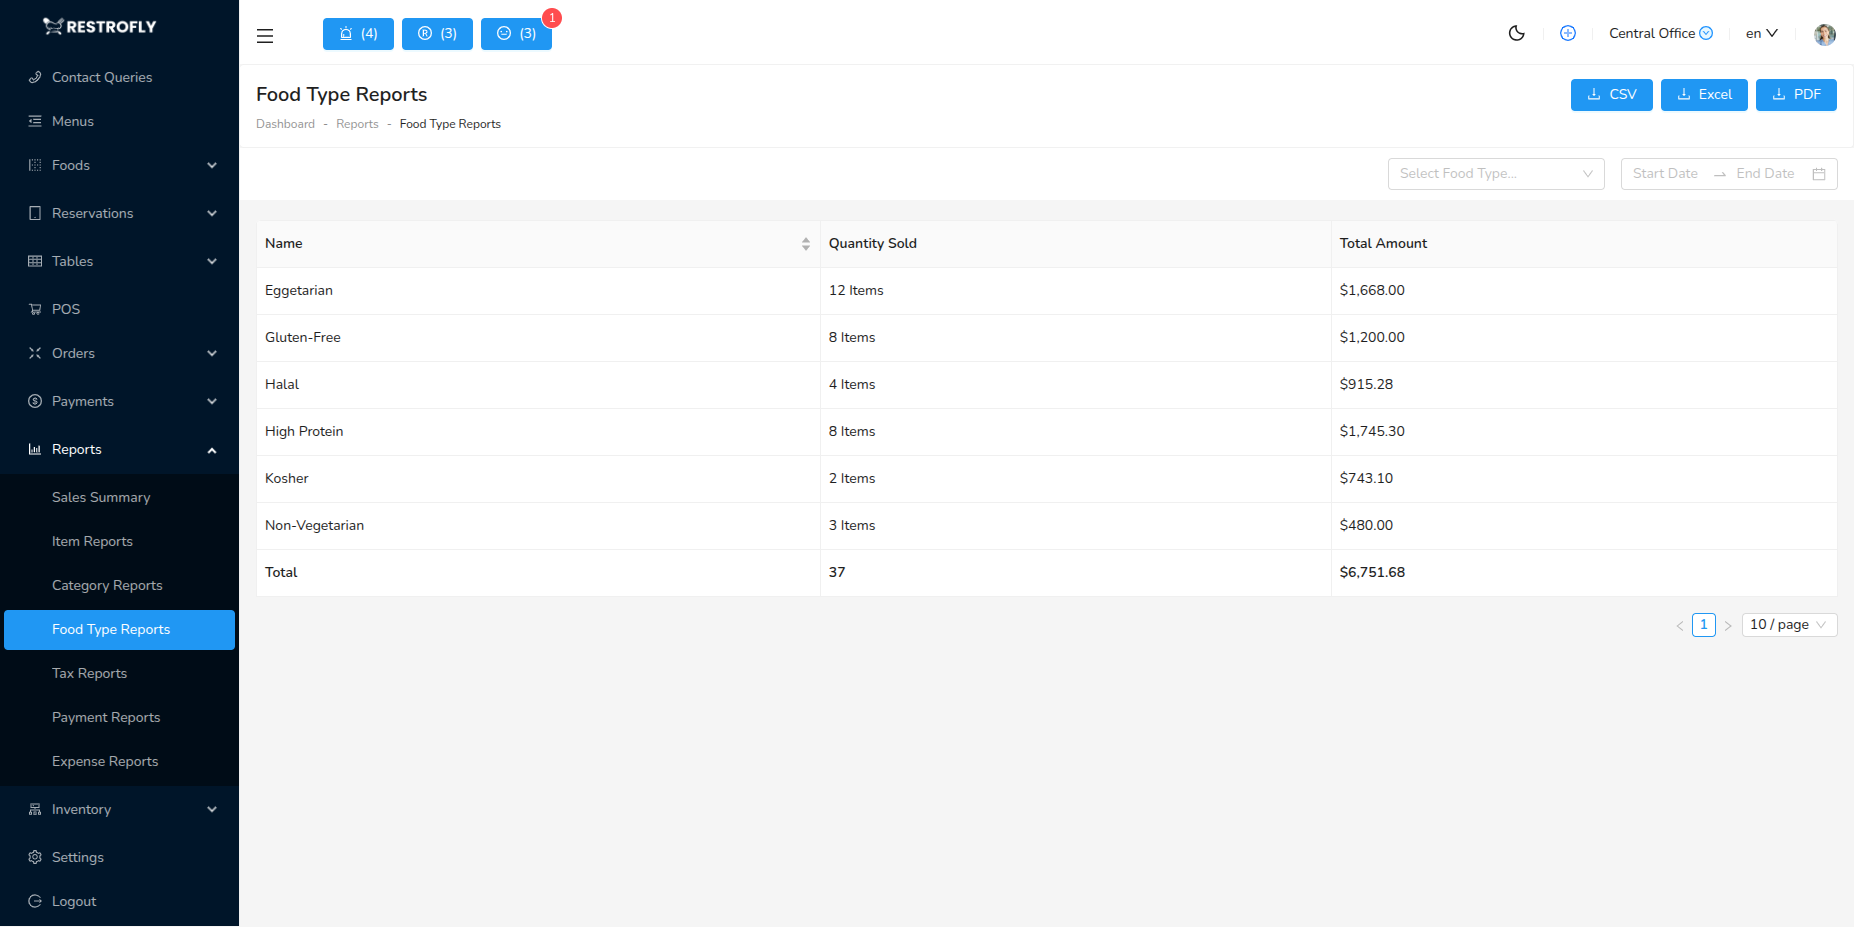
Food Type Reports provide sales analysis based on food type classifications. This report offers an even higher-level view than categories, helping you understand broad food classification trends.
What This Report Shows
Food Type Reports display sales aggregated by food type:
- Food Type Name: Broad classification (e.g., Vegetarian, Non-Vegetarian, Vegan, Gluten-Free)
- Total Quantity: Combined units sold across all items of this type
- Total Amount: Total revenue from this food type
Data Fetching Process
The system retrieves food type data from the food-type-reports API endpoint:
API Details:
- URL: /api/food-type-reports
- Method: POST
- Parameters:
- dates: [start_date, end_date]
- food_type_id: (optional) Filter by specific food type
- food_type_summary: true
The report aggregates all food items marked with a specific food type and calculates combined sales figures. Each food type appears as a single row with totals from all matching items.
Understanding Food Types
Food Types are high-level classifications that can span multiple categories:
- Vegetarian: Meat-free items across all categories
- Non-Vegetarian: Items containing meat/poultry/seafood
- Vegan: Plant-based, no animal products
- Gluten-Free: Suitable for gluten-intolerant customers
- Dairy-Free: No milk or dairy products
- Spicy: Hot/spiced items
- Mild: Non-spicy alternatives
- Custom Types: Any classifications you define
A food item can belong to a Category (organizational) and a Food Type (classification). For example, a "Garden Salad" might be in the "Appetizers" category and marked as "Vegetarian" food type.
Filter Options
By Date Range
- Track food type trends over time
- Identify changing customer preferences
- Plan menu adjustments based on demand
By Specific Food Type
- Focus analysis on one classification
- Deep dive into vegetarian vs non-vegetarian sales
- Understand dietary preference trends
Summary Calculations
The report totals:
- Total Quantity: Sum of all units across food types
- Total Revenue: Sum of all sales across food types
- Helps calculate percentage distribution
Use Cases
Dietary Preference Analysis
- Understand customer dietary preferences
- Identify growing trends (vegan, gluten-free, etc.)
- Plan menu offerings to match demand
Market Positioning
- Determine if you're meeting dietary needs
- Identify underserved dietary segments
- Expand offerings for popular types
Menu Planning
- Balance food types across menu
- Ensure adequate options for all preferences
- Add items in high-demand food types
Marketing & Labeling
- Promote specific food types (Vegan Week, etc.)
- Clearly mark food types on menu
- Attract specific customer segments
Allergen Management
- Track gluten-free and dairy-free sales
- Justify investments in allergen-safe preparation
- Understand allergen-conscious customer base
Analyzing Food Type Data
Market Trends
- Rising vegan sales indicate plant-based trend
- Compare year-over-year changes
- Adapt menu to evolving preferences
Revenue Opportunities
- Low vegetarian sales may indicate limited options
- High demand for specific types suggests expansion potential
- Premium pricing for specialized dietary options
Customer Demographics
- Food type preferences reflect customer base
- Health-conscious vs traditional diners
- Adjust marketing to attract desired customers
Operational Considerations
- High gluten-free demand may justify dedicated prep area
- Vegan offerings may require plant-based ingredient suppliers
- Staff training on dietary restrictions
Dietary Trends
Monitor food type reports quarterly to spot emerging dietary trends. Being early to offer popular options (like plant-based proteins) can give you competitive advantage.
5. Tax Reports
Tax Reports provide detailed breakdowns of all taxes collected on orders. This report is essential for tax compliance, remittance, and accounting.
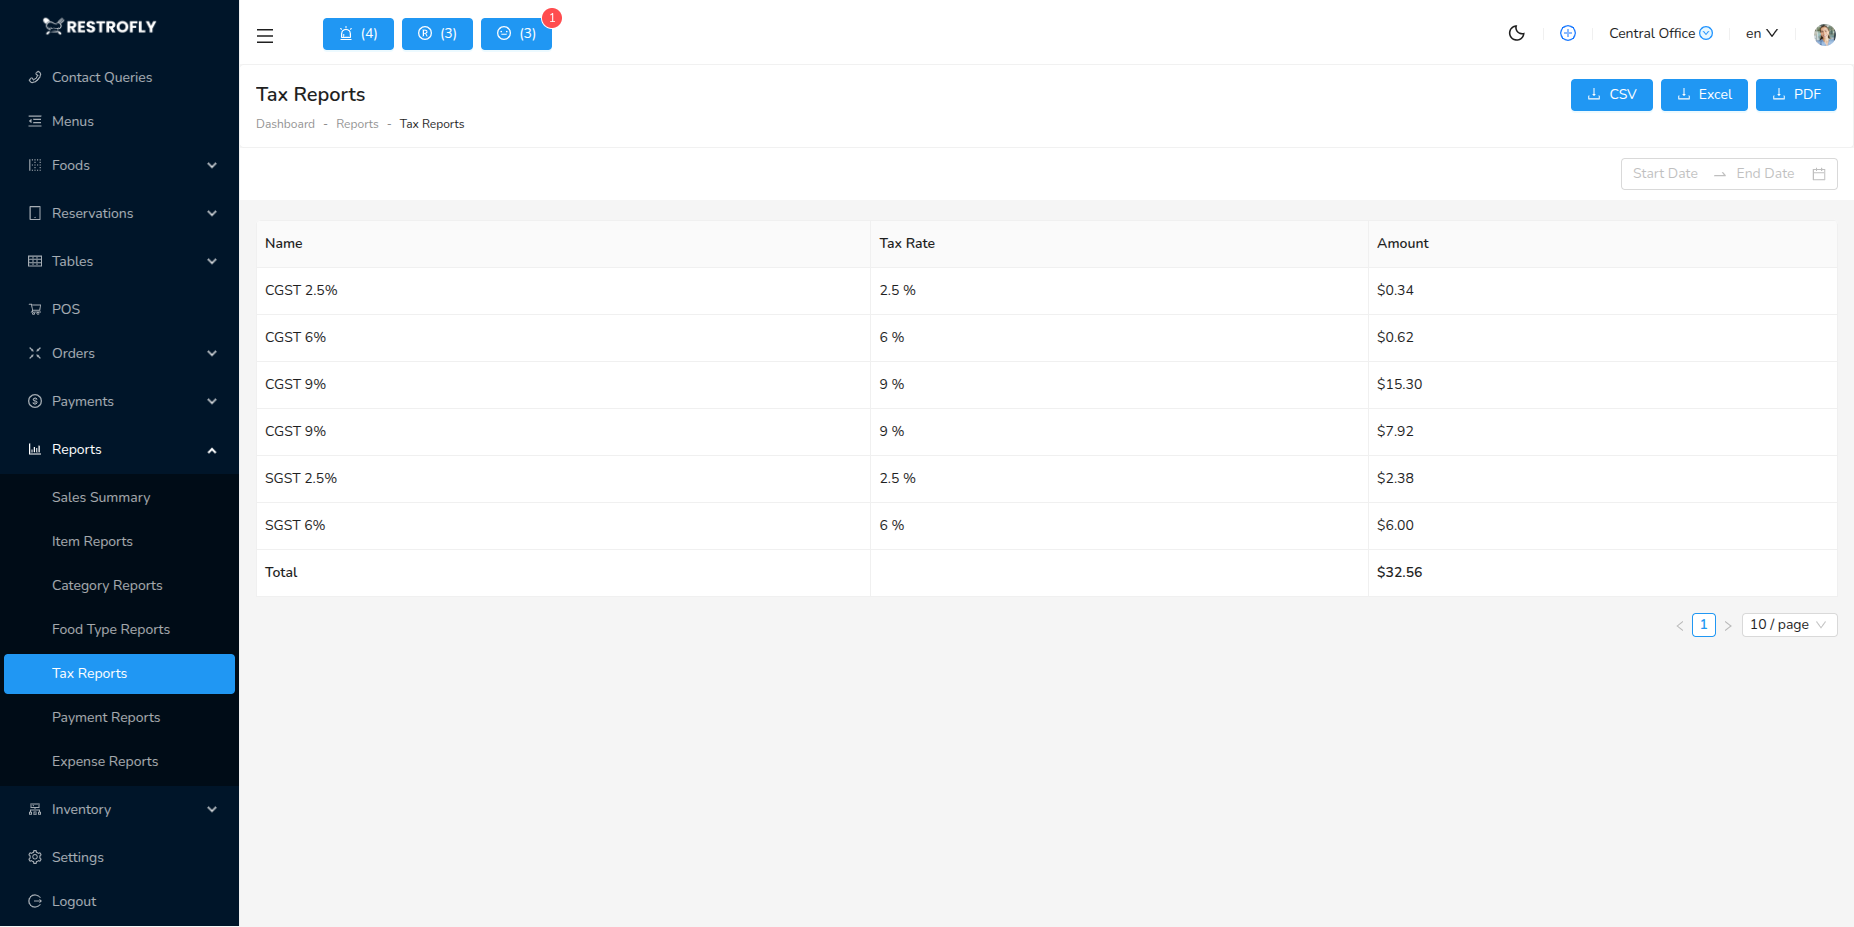
What This Report Shows
Tax Reports display tax collection data:
- Tax Name: Name of the tax (GST, VAT, Sales Tax, Service Charge, etc.)
- Tax Rate: Percentage rate for this tax
- Amount: Total tax amount collected for this tax in the period
Data Fetching Process
The system fetches tax data from the tax-reports API endpoint:
API Details:
- URL: /api/tax-reports
- Method: POST
- Parameters:
- dates: [start_date, end_date]
- order_tax_summary: true
The report analyzes all orders within the date range and calculates the total tax collected for each tax type. Taxes are applied at the food item level, and the system aggregates all instances where each tax was charged.
How Taxes Are Calculated
When orders are created in Restrofly:
- Each food item has an assigned tax (configured in Food Items)
- Tax can be Single or Multiple (combination of taxes)
- Tax amount = Item subtotal × Tax rate
- Order total = Subtotal + All applicable taxes
The Tax Report shows the cumulative tax collected from all orders, broken down by tax type.
Understanding Multiple Taxes
If you use multiple taxes (e.g., CGST + SGST in India):
- Each component tax appears as a separate line
- Example: CGST 9% and SGST 9% both show separately
- Combined rate (18%) is calculated by adding components
- Report shows individual tax amounts for compliance
Filter Options
By Date Range
- Select tax period for reporting (monthly, quarterly, yearly)
- Match your tax filing period
- Compare tax collection over time
Summary Calculations
The report provides:
- Total Tax Collected: Sum of all tax amounts across all tax types
- This is your total tax liability for the period
- Use for tax remittance and filing
Use Cases
Tax Compliance & Filing
- Generate monthly/quarterly tax reports
- Calculate tax liability for remittance
- Provide documentation for tax audits
- File GST/VAT returns with accurate data
Accounting & Bookkeeping
- Separate tax collected from revenue
- Record tax liability in accounts
- Reconcile tax payments
- Prepare financial statements
Business Analysis
- Understand tax burden on business
- Calculate effective tax rate
- Plan pricing to absorb tax costs
- Compare pre-tax and post-tax revenue
Multi-Tax Jurisdictions
- Track different taxes separately (CGST, SGST, IGST)
- Handle interstate vs intrastate taxes
- Comply with complex tax regulations
- Allocate taxes to correct authorities
Tax Report Best Practices
Regular Generation
- Generate tax reports monthly minimum
- Align with your tax filing schedule
- Don't wait until filing deadline
Verification
- Cross-check with payment collections
- Ensure all taxes properly recorded
- Verify rates match tax configuration
Documentation
- Export and save PDF copies for records
- Keep reports for audit trail
- Store securely for required retention period (usually 5-7 years)
Reconciliation
- Match report totals with actual tax payments
- Identify and resolve discrepancies immediately
- Maintain separate tax liability account
Tax Compliance
Tax reports must be accurate for legal compliance. Verify your tax configuration matches current tax laws. Consult with tax professionals or accountants to ensure correct tax setup and reporting.
Tax Filing
Export Tax Reports as Excel at month-end. This gives you a ready reference for tax filing. Many tax filing portals allow direct import of tax data from spreadsheets.
6. Payment Reports (Payment Mode Summary)
Payment Reports provide detailed analysis of payment collection by payment method. This report is critical for cash flow management and daily reconciliation.
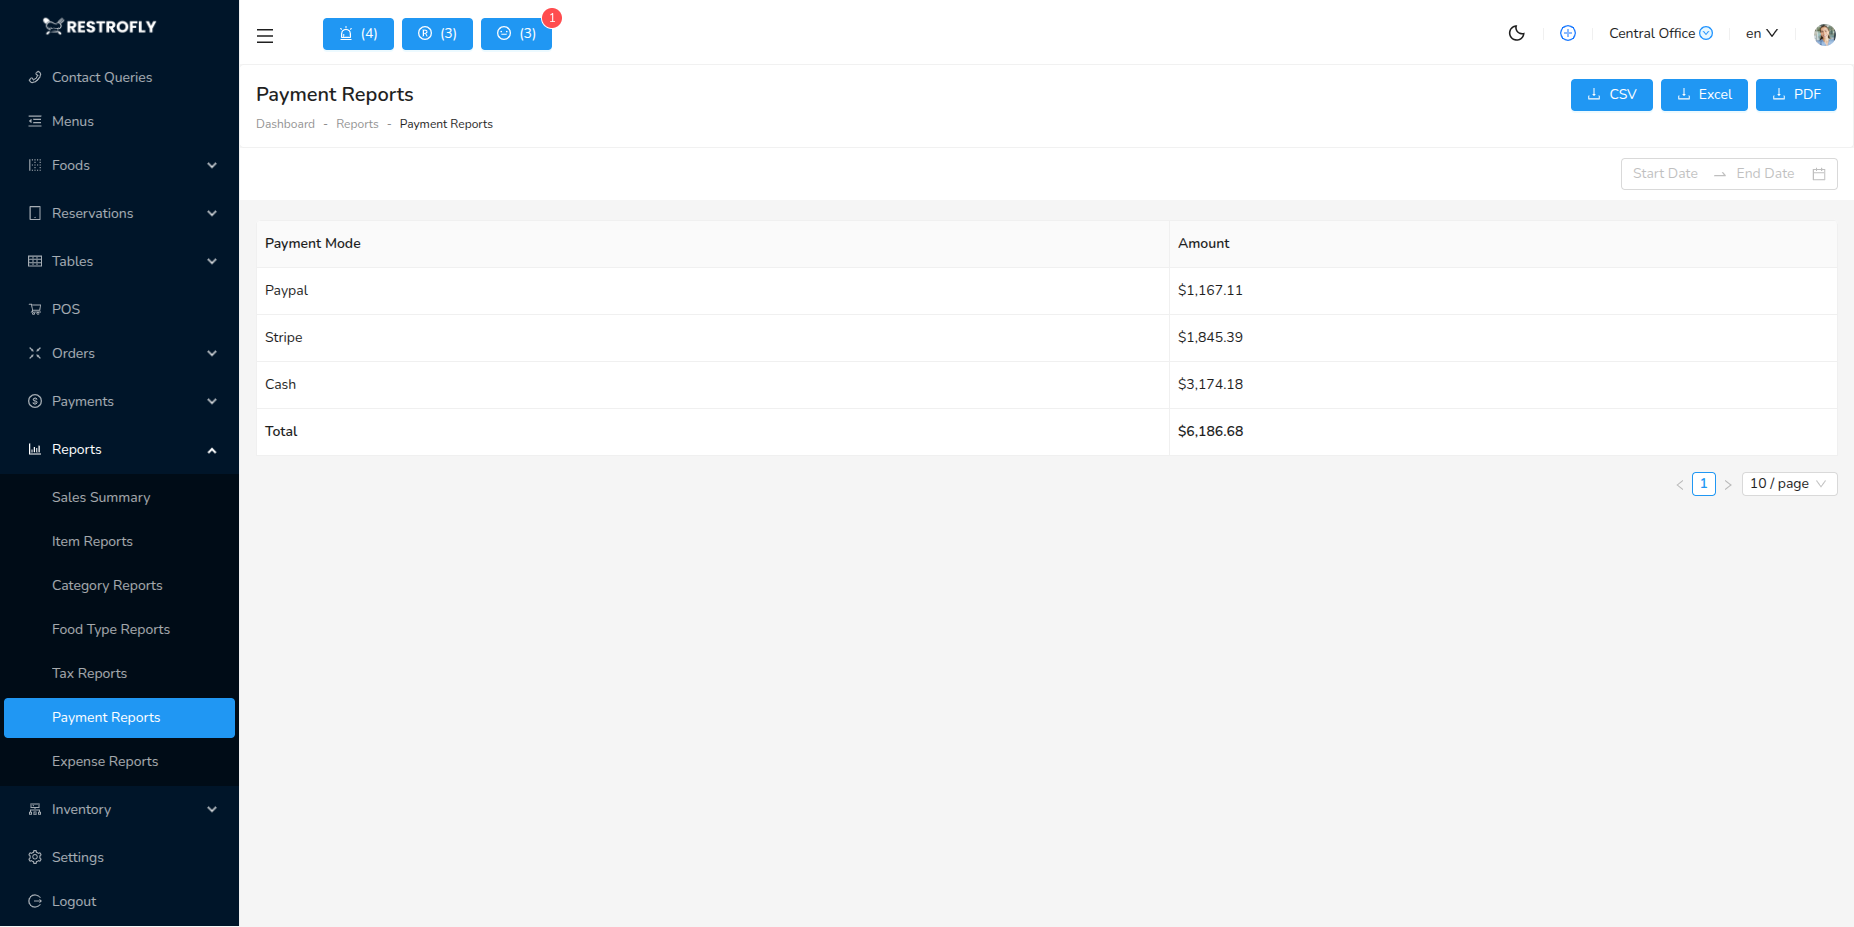
What This Report Shows
Payment Reports display payment mode data:
- Payment Mode: Method used for payment (Cash, Credit Card, Debit Card, UPI, etc.)
- Total Amount: Total payments collected through this payment mode in the period
Data Fetching Process
The system retrieves payment data from the payment-reports API endpoint:
API Details:
- URL: /api/payment-reports
- Method: POST
- Parameters:
- dates: [start_date, end_date]
- order_payment_summary: true
The report aggregates all payments recorded in orders, grouping them by the payment mode selected during payment processing. Each payment mode shows the total amount collected through that method.
Understanding Payment Modes
Payment modes in Restrofly are categorized as:
Cash Type Payment Modes
- Cash: Physical currency payments
- Petty Cash: Small cash transactions
- Tracked separately for cash drawer reconciliation
Bank Type Payment Modes
- Credit Card: Card payments (Visa, Mastercard, Amex)
- Debit Card: Debit card transactions
- UPI: Digital payments (Google Pay, PhonePe, Paytm)
- Bank Transfer: Direct bank transfers
- Digital Wallets: Apple Pay, PayPal, Samsung Pay
- Gift Cards: Gift card redemptions
Each payment mode configured in your system (Settings → Payment Modes) appears in this report if payments were received through it.
Filter Options
By Date Range
- Daily: For end-of-day reconciliation
- Weekly: Track weekly cash flow
- Monthly: Month-end financial closing
- Custom: Any specific period
Summary Calculations
The report totals:
- Total Payments: Sum of all amounts across all payment modes
- Should match total sales revenue (unless there are unpaid orders)
- Used for daily deposit verification
Use Cases
Daily Cash Reconciliation
- Count physical cash in drawer
- Compare to Cash payment mode total
- Identify shortages or overages
- Document discrepancies
Bank Deposit Verification
- Check card terminal reports against Credit/Debit Card totals
- Verify UPI settlements match report
- Reconcile bank deposits with report amounts
- Ensure all electronic payments settled
Cash Flow Management
- Track cash vs digital payment ratios
- Plan cash drawer requirements
- Optimize payment mode offerings
- Understand payment preferences
Financial Reporting
- Prepare daily/weekly sales reports
- Break down revenue by payment method
- Track trends in payment preferences
- Report to management or ownership
Fraud Detection
- Identify unusual payment patterns
- Compare cash percentages to historical average
- Flag suspicious discrepancies
- Verify large transactions
Payment Report Best Practices
Daily Reconciliation
- Generate payment report at end of day
- Count cash drawer and compare to Cash total
- Check card terminal batch report vs Card totals
- Verify UPI settlements in banking app
- Document any variances
- Prepare bank deposit
Payment Method Analysis
- Monitor shift from cash to digital
- Ensure sufficient cash for change
- Optimize card processing fees
- Promote preferred payment methods
Settlement Tracking
- Card payments settle 1-2 business days later
- UPI settles immediately or next day
- Track pending settlements
- Reconcile when funds received
Variance Investigation
- Small variances (< 1%) are normal from change errors
- Large variances need immediate investigation
- Review transactions for the day
- Check for voided or refunded payments
Understanding Cash vs Digital
Cash Payments
- Immediate access to funds
- No processing fees
- Risk of theft or loss
- Manual reconciliation required
- Cash drawer management
Digital Payments
- Processing fees (1-3%)
- Settlement delays (1-2 days)
- Electronic tracking
- Reduced theft risk
- Automatic reconciliation
Mixed Payments
- Some orders may have split payments
- System records each payment separately
- Total for order may span multiple modes
- Ensure all payment portions recorded
Daily Discipline
Generate and reconcile payment reports EVERY day before closing. This habit prevents accumulation of errors and ensures accurate financial records. It takes 10 minutes daily vs hours of detective work monthly.
Cash Handling
Cash totals in Payment Reports should match physical cash on hand. Frequent discrepancies indicate training issues, process problems, or potential theft. Address immediately.
7. Expense Reports
Expense Reports track all business expenses with category-wise breakdown and provide print/export options for expense management and accounting.
Data Retrieval
The system fetches expense data from the expense-reports API endpoint with the following parameters:
API Details:
- URL: /api/expense-reports
- Method: POST
- Parameters:
- dates: [start_date, end_date] - Filter expenses by date range
- expense_category_id: (optional) - Filter by specific expense category
- expense_summary: true - Indicates expense summary report generation
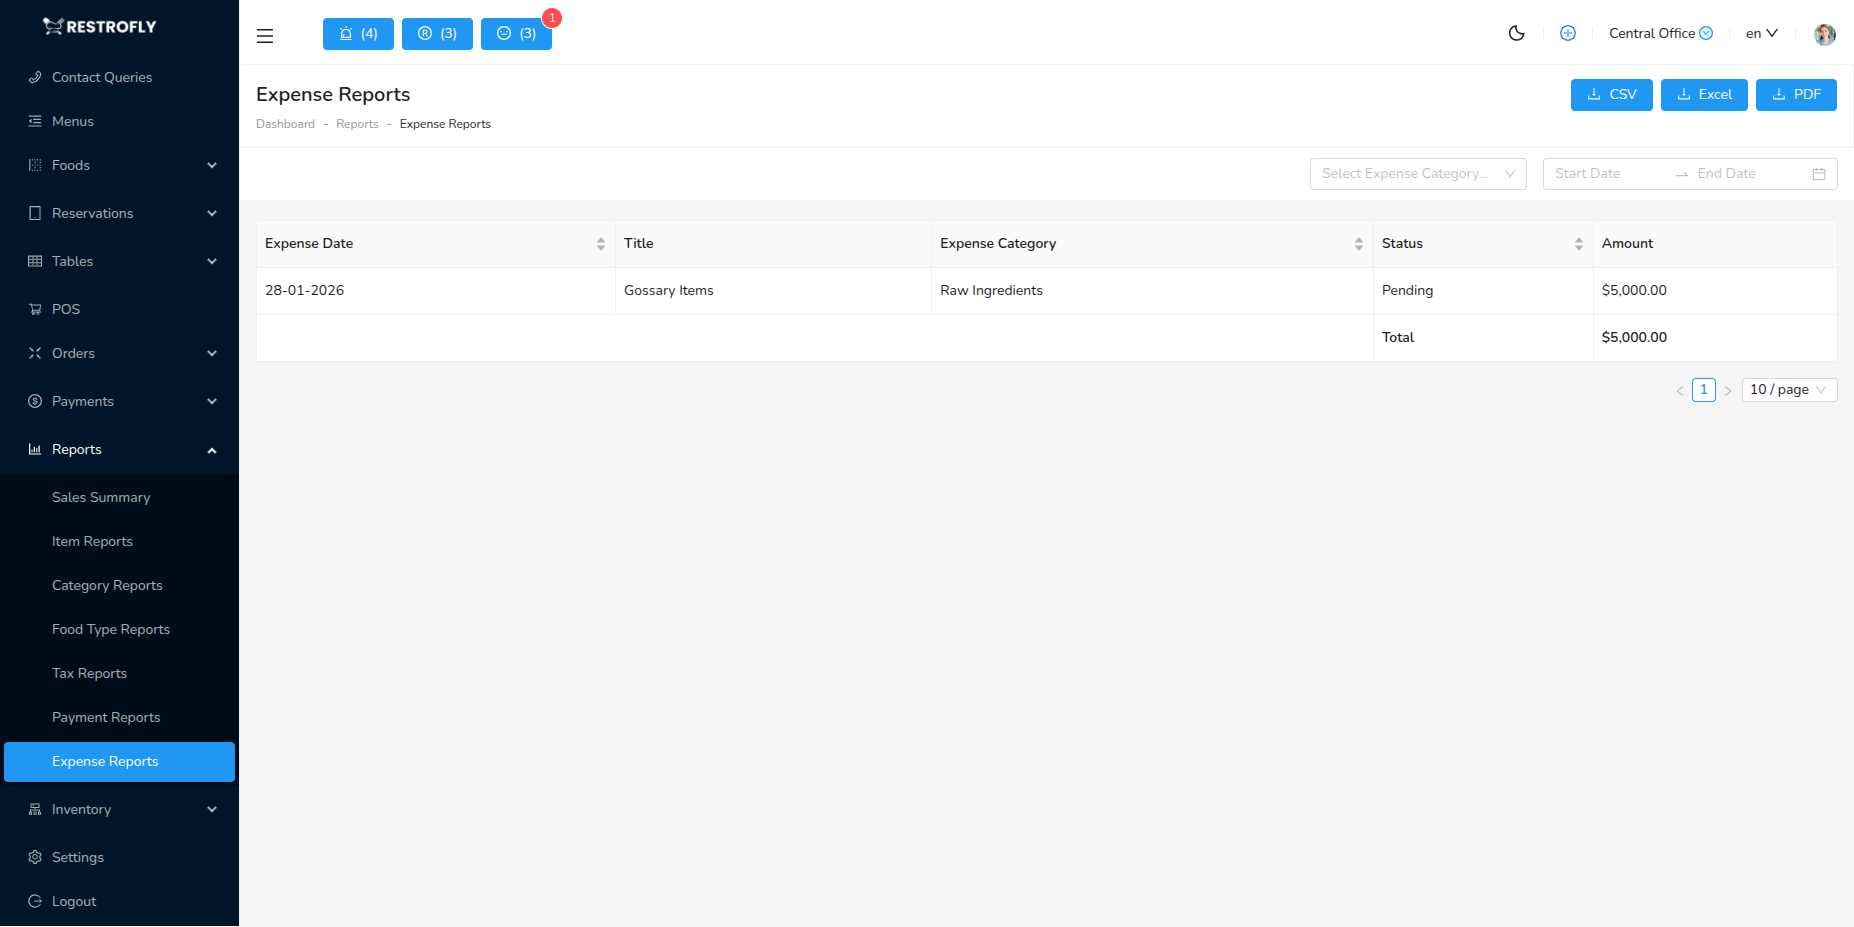
Displayed Fields
- Expense Date: Date when expense was incurred
- Title: Description of the expense
- Amount: Expense amount in restaurant's currency
- Status: Expense status (pending, approved, paid)
- Expense Category: Category classification (utilities, supplies, maintenance, etc.)
- Payment Mode: Method used for payment (cash, card, bank transfer)
Summary Calculations
The report automatically calculates:
- Total Amount: Sum of all expenses in the selected period
- Displayed in the table footer for quick reference
Use Cases
Monthly Expense Tracking
- Review total expenses by category
- Identify cost-saving opportunities
- Track budget vs actual spending
Accounting & Bookkeeping
- Export expense data for accounting software
- Generate expense reports for tax filing
- Maintain expense records with category breakdown
Budget Management
- Monitor recurring expenses (rent, utilities)
- Track variable costs (supplies, maintenance)
- Analyze expense trends over time
Export Options
Expense reports can be exported in multiple formats:
- Print: Direct print for physical records
- CSV: For spreadsheet analysis
- PDF: For formal documentation
- Excel: For detailed analysis and charts
Expense Categorization
Properly categorize all expenses for accurate reporting. Use consistent categories to track spending patterns and identify areas where costs can be optimized.
Report Generation Workflow
Step 1: Access Reports Module
Navigate to Reports from the main menu. You'll see categories of available reports.
Step 2: Select Report Type
Choose the specific report you want to generate:
- Sales Summary
- Item Reports
- Category Reports
- Food Type Reports
- Tax Reports
- Payment Reports
- Others (Expense, Inventory, Customer, Reservation reports)
Step 3: Set Filters
Configure report parameters:
Date Range (Required)
- Quick options: Today, Yesterday, This Week, This Month, Last Month
- Custom Range: Pick specific start and end dates
- Date range affects all data displayed
Branch Filter (Multi-branch only)
- Select specific branch or "All Branches"
- Reports filter to selected branch automatically
Additional Filters (Report-specific)
- Sales Summary: Customer, Order Type
- Item Reports: Food Category, Specific Item
- Category Reports: Specific Category
- Food Type Reports: Specific Food Type
- Tax Reports: No additional filters
- Payment Reports: No additional filters
Step 4: Generate Report
Click Generate Report or View Report button. The system:
- Fetches data from database
- Applies all selected filters
- Calculates totals and summaries
- Displays results in table format
Wait a few seconds for large date ranges or busy periods.
Step 5: Review Data
Analyze the displayed report:
- Scroll through all rows
- Check summary totals at bottom
- Verify data matches expectations
- Look for trends or anomalies
Step 6: Export (Optional)
Click Export button to download:
CSV Format
- Comma-separated values
- Opens in Excel, Google Sheets, Numbers
- Useful for further analysis or manipulation
- Can be imported into accounting software
PDF Format
- Formatted, printable document
- Professional appearance
- Includes header, footer, page numbers
- Good for sharing with stakeholders or filing
Excel Format (XLSX)
- Native Excel format with formatting
- Formulas preserved
- Multiple sheets if applicable
- Best for analysis in Excel
Step 7: Save or Share
- Save exported files to appropriate location
- Add to accounting records
- Share with management, accountant, or partners
- Archive for future reference
Report Analysis Tips
Trend Analysis
Compare Periods
- Run same report for different date ranges
- Compare this month to last month
- Year-over-year comparisons
- Identify growth or decline trends
Identify Patterns
- Day-of-week patterns (weekends vs weekdays)
- Seasonal variations
- Event-driven spikes
- Gradual shifts over time
Problem Identification
Red Flags to Watch
- Declining sales trends
- Increasing payment discrepancies
- Growing tax liabilities
- Inventory shrinkage
- Customer count drop
Early Warning Signs
- Single category dominating sales (menu imbalance)
- Specific items always out of stock
- Payment method issues
- Tax configuration errors
Opportunity Discovery
Growth Opportunities
- Underperforming categories to expand
- Popular items to promote more
- Successful food types to emphasize
- Profitable order types to encourage
Efficiency Gains
- Items to remove from menu (slow sellers)
- Categories to consolidate
- Peak times for staffing
- Preferred payment methods
Data-Driven Decisions
Use reports to make informed choices:
Menu Decisions
- Add items in popular categories
- Remove items with <10 sales per month
- Adjust pricing based on demand
- Introduce variants of bestsellers
Operational Decisions
- Staff scheduling based on busy periods
- Inventory ordering based on item sales
- Kitchen prep based on demand forecasts
- Payment method acceptance
Marketing Decisions
- Promote underperforming items
- Highlight bestsellers
- Create combo offers
- Target specific customer segments
Financial Decisions
- Pricing adjustments
- Cost control priorities
- Investment in equipment
- Expansion planning
Troubleshooting Reports
Report Not Loading
Problem: Report page shows loading spinner indefinitely
Solutions:
- Check internet connection
- Refresh the page
- Try a smaller date range
- Clear browser cache
- Check if server is responsive
No Data Displayed
Problem: Report generates but shows zero records
Solutions:
- Verify date range includes active business days
- Check if orders exist in that period
- Remove all filters and try again
- Confirm branch filter is correct
- Check if data actually exists
Export Not Working
Problem: Export button doesn't download file
Solutions:
- Check browser's download settings
- Allow pop-ups for this site
- Try different export format
- Disable browser extensions temporarily
- Use different browser
Incorrect Totals
Problem: Summary totals don't match expectations
Solutions:
- Verify filters applied correctly
- Check if cancelled orders are excluded
- Confirm date range boundaries
- Review individual line items
- Regenerate report
Slow Report Generation
Problem: Reports take very long to load
Solutions:
- Reduce date range
- Generate during off-peak hours
- Remove unnecessary filters
- Check server performance
- Contact support if persistent
Best Practices
Daily Reporting Routine
Every Day
- Generate Sales Summary for the day
- Generate Payment Report and reconcile
- Check discrepancies immediately
- Export and save for records
Weekly Analysis
Every Week
- Review Item Reports to track menu performance
- Check Category Reports for balance
- Analyze Food Type trends
- Compare to previous week
Monthly Procedures
End of Month
- Generate all reports for the month
- Export Tax Reports for filing
- Create Payment Report for accounting
- Archive all reports securely
Month-End Analysis
- Compare to previous month
- Calculate growth rates
- Identify trends
- Plan next month actions
Quarterly Reviews
Every Quarter
- Deep dive into all report types
- Year-over-year comparisons
- Strategic planning based on data
- Menu optimization
- Pricing reviews
Documentation & Storage
File Organization
- Create folder structure: Year → Month → Report Type
- Consistent naming: "Sales_Summary_2026-01.pdf"
- Separate folders for daily, monthly, annual reports
Retention Policy
- Keep daily reports: 1 year
- Keep monthly reports: 7 years (tax requirement)
- Keep annual reports: Indefinitely
- Backup to cloud storage
Access Control
- Limit report access to authorized staff
- Use role-based permissions
- Audit who generates reports
- Secure sensitive financial data
Report Automation
Set a reminder to generate key reports at the same time daily/weekly/monthly. Consistency in reporting builds accurate historical data and makes trend analysis more reliable.
Report Features
Date Comparison: Compare this period vs last period, year-over-year comparison, identify growth/decline
Visual Charts: Graphs and charts for visual analysis, trend lines, pie charts for breakdowns
Summary Totals: Grand totals, subtotals by category, percentage breakdowns
Drill-Down: Click to see detailed transactions, trace to source data, investigate anomalies
Best Practices
Regular Reporting: Generate key reports daily (sales, payments), weekly reviews (inventory, expenses), monthly comprehensive analysis
Multiple Perspectives: View data from different angles, cross-reference reports, validate findings
Action-Oriented: Use reports to make decisions, identify problems and opportunities, track improvement initiatives
Share with Team: Distribute relevant reports to managers, discuss findings in meetings, align team on goals
Trend Analysis: Look at long-term trends not just snapshots, seasonal patterns, year-over-year growth
Benchmark: Compare to industry standards, compare to your own goals, track KPIs consistently
Data Accuracy: Verify report data accuracy, investigate unusual numbers, ensure proper data entry
Scheduled Reports: Set up automated report generation, email reports to stakeholders, consistent review cadence
Dashboard vs Reports
Use Dashboard for real-time monitoring during operations. Use Reports for detailed historical analysis and strategic planning.
End-of-Day Reports
Run sales, payment, and collection reports at end of each day without fail. This daily discipline ensures accurate books and catches errors immediately.